
Bu strateji ile, SuperTrend göstergesinin verdiği al/sat sinyallerine uygun olarak long işlemlere giriş ve çıkış yapabiliriz.
Stratejide, alım işlemi koşulu için, SuperTrend göstergesi, EMA 200 ile birlikte kullanılır.
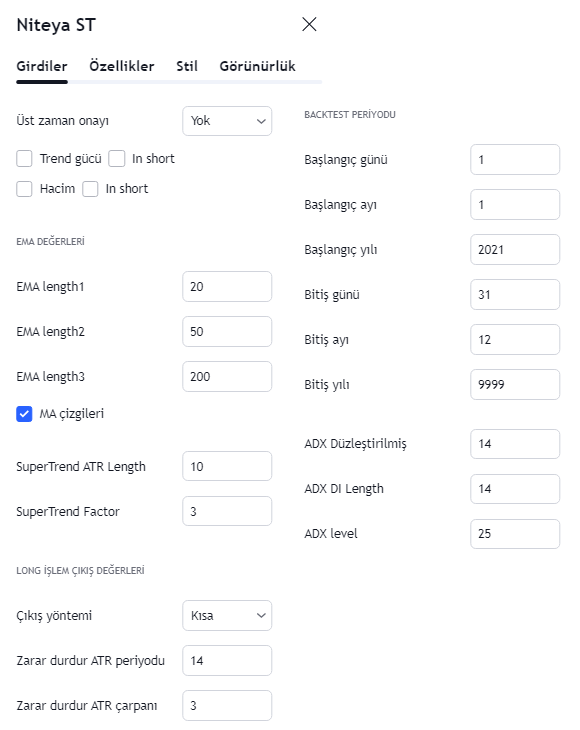
Strateji dahilinde, stratejiye ait ön tanımlı değerler değiştirilebilir:
Aşağıdaki grafikte, stratejiyi yüklediğimizde ekrana gelecek olan tablonun değerleri ve açıklamaları gösterilmektedir:
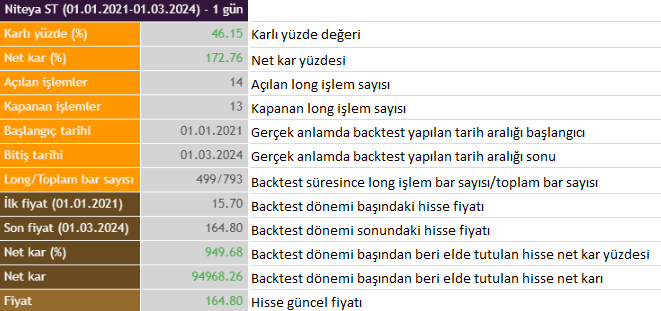
Stratejinin temel değerleri ve anlamları aşağıda gösterilmektedir:
Bu ayarlar, stratejinin "Ayarlar/Özellikler" sekmesinde değiştirilebilir.
Aşağıdaki grafikte, stratejinin ön tanımlı değerleri gösterilmektedir:
// This source code is subject to the terms of the Mozilla Public License 2.0 at https://mozilla.org/MPL/2.0/
// © Niteya (www.bilgigunlugum.net)
//@version=5
// Bu strateji şablonu sadece eğitim amaçlı olarak verilmiştir. Yatırım kararlarınızda kullanmayınız.
strategy("Niteya Strategy SuperTrend", shorttitle='Niteya ST', overlay=true, calc_on_every_tick=true, commission_value=0.04, initial_capital=10000, default_qty_type=strategy.cash, default_qty_value=10000)

up_tf_confirmation = input.string('Yok', title="Üst zaman onayı", options=['Yok', '1', '2'])

per1 = timeframe.period
per1_ok = timeframe.isminutes or timeframe.isdaily

string per2 = switch
    per1=='1' => '3'
    per1=='3' => '5'
    per1=='5' => '15'
    per1=='15' => '30'
    per1=='30' => '60'
    per1=='60' => '120'
    per1=='120' => '240'
    per1=='180' => 'D'
    per1=='240' => 'D'
    str.pos(per1, "D")>=0 => 'W'

string per3 = switch
    per1=='1' => '5'
    per1=='3' => '15'
    per1=='5' => '30'
    per1=='15' => '60'
    per1=='30' => '120'
    per1=='60' => '240'
    per1=='120' => 'D'
    per1=='180' => 'W'
    per1=='240' => 'W'
    str.pos(per1, "D")>=0 => 'M'

is_trend = input.bool(false, title="Trend gücü", inline='adx')
trend_short = input.bool(false, title="In short", inline='adx')
is_volume = input.bool(false, title="Hacim", inline='volume')
volume_short = input.bool(false, title="In short", inline='volume')

// EMA giriş değerleri
var string ema_group = 'EMA değerleri'
ema_length1 = input(20, 'EMA length1', group=ema_group)
ema_length2 = input(50, 'EMA length2', group=ema_group)
ema_length3 = input(200, 'EMA length3', group=ema_group)
is_ema_lines = input.bool(true, title='MA çizgileri', group=ema_group)

// SuperTrend değerleri
atrPeriod = input(10, "SuperTrend ATR Length")
factor = input.float(3.0, "SuperTrend Factor", step = 0.01)

[close_g2, high_g2, low_g2] = request.security(syminfo.tickerid, per2, [close, high, low])
[close_g3, high_g3, low_g3] = request.security(syminfo.tickerid, per3, [close, high, low])

atr_n(length, close_g, high_g, low_g) =>
    trueRange = na(high_g[1])? high_g-low_g : math.max(high_g - low_g, math.abs(high_g - close_g[1]), math.abs(low_g - close_g[1]))
    ta.rma(trueRange, length)

supertrend_bg(factor, atrPeriod, close_g, high_g, low_g) =>
	src_st = (high_g + low_g)/2
	atr = atr_n(atrPeriod, close_g, high_g, low_g)
	upperBand = src_st + factor * atr
	lowerBand = src_st - factor * atr
	prevLowerBand = nz(lowerBand[1])
	prevUpperBand = nz(upperBand[1])

	lowerBand := lowerBand > prevLowerBand or close_g[1] < prevLowerBand ? lowerBand : prevLowerBand
	upperBand := upperBand < prevUpperBand or close_g[1] > prevUpperBand ? upperBand : prevUpperBand
	int direction = na
	float superTrend = na
	prevSuperTrend = superTrend[1]
	if na(atr[1])
		direction := 1
	else if prevSuperTrend == prevUpperBand
		direction := close_g > upperBand ? -1 : 1
	else
		direction := close_g < lowerBand ? 1 : -1
	superTrend := direction == -1 ? lowerBand : upperBand
	[superTrend, direction]

// SuperTrend hesaplamaları
[supertrend1, direction1] = supertrend_bg(factor, atrPeriod, close, high, low)
[supertrend2, direction2] = supertrend_bg(factor, atrPeriod, close_g2, high_g2, low_g2)
[supertrend3, direction3] = supertrend_bg(factor, atrPeriod, close_g3, high_g3, low_g3)

up_tf = switch up_tf_confirmation
    'Yok' => 0
    '1' => 1
    '2' => 2

st_long = (up_tf==2 and per1_ok) ? (direction1<0 and direction2<0 and direction3<0) : (up_tf==1 and per1_ok) ? (direction1<0 and direction2<0) : direction1<0
st_short = (up_tf==2 and per1_ok) ? (direction1>=0 and direction2>=0 and direction3>=0) : (up_tf==1 and per1_ok) ? (direction1>=0 and direction2>=0) : direction1>=0

st_value = st_long ? 1 : st_short ? -1 : 0

// EMA
ema_11 = ta.ema(close, ema_length1)
ema_12 = ta.ema(close, ema_length2)
ema_13 = ta.ema(close, ema_length3)

plot(is_ema_lines ? ema_11 : na, title="MA src1", color=color.blue, linewidth=1)
plot(is_ema_lines ? ema_12 : na, title="MA src2", color=color.orange, linewidth=2)
plot(is_ema_lines ? ema_13 : na, title="MA src3", color=color.black, linewidth=3)

var long_vals = "Long işlem çıkış değerleri"
sl_method = input.string('Short', title="Çıkış yöntemi", options=['Stop loss', 'Short', 'Both'], group=long_vals)
// Zarar durdur için ATR giriş değerleri
atr_period = input.int(14, 'Zarar durdur ATR periyodu', minval=7, step=1, group=long_vals)
atr_multiplier = input.float(3, 'Zarar durdur ATR çarpanı', minval=1.5, step=0.1, group=long_vals)

// Backtest periyodu
var backtest = "Backtest periyodu"
StartDay = input(1, 'Başlangıç günü', group=backtest)
StartMonth = input(1, 'Başlangıç ayı', group=backtest)
StartYear = input(2021, 'Başlangıç yılı', group=backtest)
PeriodStart = timestamp(StartYear, StartMonth, StartDay, 0, 0)

StopDay = input(31, 'Bitiş günü', group=backtest)
StopMonth = input(12, 'Bitiş ayı', group=backtest)
StopYear = input(9999, 'Bitiş yılı', group=backtest)
PeriodStop = timestamp(StopYear, StopMonth, StopDay, 0, 0)

// DMI değerleri
dmi_lensig = input.int(14, title="ADX Smoothing", minval=1, maxval=50)
dmi_len = input.int(14, minval=1, title="ADX DI Length")
dmi_level = input.int(25, minval=20, title="ADX level")
up = ta.change(high)
down = -ta.change(low)
plusDM = na(up) ? na : (up > down and up > 0 ? up : 0)
minusDM = na(down) ? na : (down > up and down > 0 ? down : 0)
trur = ta.rma(ta.tr, dmi_len)
plus = fixnan(100 * ta.rma(plusDM, dmi_len) / trur)
minus = fixnan(100 * ta.rma(minusDM, dmi_len) / trur)
sum = plus + minus
adx = 100 * ta.rma(math.abs(plus - minus) / (sum == 0 ? 1 : sum), dmi_lensig)
trend_value = adx>adx[1] and adx>=dmi_level and adx>=ta.sma(adx, 10) ? 1 : 0

// Hacim hesaplama
volume_value = (volume >= 1.1 * ta.sma(volume, 10)) ? 1 : 0

var int long_index = 0
var float long_price = 0.00
var int stop_index = 0
var float stop_val = 0.00

var int long_no = 0
var int close_no = 0

// ATR hesaplama
atr_long = ta.atr(atr_period)

// İz süren stop hesaplama
stop_loss_atr = atr_multiplier * atr_long
Trail = 0.0
iff_1 = close > nz(Trail[1], 0) ? close - stop_loss_atr : close + stop_loss_atr
iff_2 = close < nz(Trail[1], 0) and close[1] < nz(Trail[1], 0) ? math.min(nz(Trail[1], 0), close + stop_loss_atr) : iff_1
Trail := close > nz(Trail[1], 0) and close[1] > nz(Trail[1], 0) ? math.max(nz(Trail[1], 0), close - stop_loss_atr) : iff_2

ema_200 = ta.ema(close, 200)

entry_long = st_value==1 and (not na(ema_200) ? close>ema_200 : true) and (is_volume ? volume_value==1 : true) and (is_trend ? trend_value==1 : true)
entry_short = st_value==-1  and (volume_short ? volume_value==1 : true) and (trend_short ? trend_value==1 : true)

entry_price_long = ta.valuewhen(entry_long, close, 0)

stop_loss_long = Trail

exit_long = close<stop_loss_long

// Aktif periyot
var int PeriodS1 = 0
var int PeriodS2 = 0

if barstate.isfirst
    if time >= PeriodStart
        PeriodS1 := timestamp(year(time), month(time), dayofmonth(time), 0, 0)
    else
        PeriodS1 := timestamp(year(PeriodStart), month(PeriodStart), dayofmonth(PeriodStart), 0, 0)

    if last_bar_time <= PeriodStop
        PeriodS2 := timestamp(year(last_bar_time), month(last_bar_time), dayofmonth(last_bar_time), 0, 0)
    else
        PeriodS2 := timestamp(year(PeriodStop), month(PeriodStop), dayofmonth(PeriodStop), 0, 0)

// Hissenin periyot içindeki ilk ve son fiyatı
var float close_s = na
var float close_e = na

if time >= PeriodS1 and na(close_s[1])
    close_s := close
else
    close_s := close_s[1]

if time >= PeriodS2 and na(close_e[1])
    close_e := close
else
    close_e := close_e[1]

var int bar_number_period = 0
var int bar_number_long = 0

In_Period() =>
    time >= PeriodStart and time <= PeriodStop ? true : false

bar_index_o = (last_bar_index - bar_index)

if In_Period()
    if entry_long and strategy.opentrades==0
        strategy.entry('long', strategy.long, comment='BUY' + '(' + str.tostring(bar_index_o+1) + ')')
        long_price := entry_price_long
        long_index := bar_index_o

        long_no += 1

    if strategy.opentrades>0 and (sl_method=='Both' ? exit_long or entry_short : (sl_method=='Stop loss' ? exit_long : entry_short))
        strategy.close('long', comment='SELL' + '(' + str.tostring(bar_index_o+1) + ')')

        close_no += 1

        stop_index := bar_index_o
        stop_val := close

        long_price := 0.00
        long_index := 0

    bar_number_period += 1
    if long_price!=0.00
        bar_number_long += 1

plot_con = In_Period() and strategy.position_size > 0

plot(plot_con and not exit_long ? stop_loss_long : na, style=plot.style_linebr, color=color.new(color.red, 0), linewidth=1, title='Stop loss level')
// plot(stop_loss_long, style=plot.style_linebr, color=color.new(color.red, 0), linewidth=1, title='Stop loss level')

GetWinRate(includeEvens = false) =>
	winTradeCount = strategy.wintrades + (includeEvens ? strategy.eventrades : 0)
	(winTradeCount / strategy.closedtrades) * 100

get_date(time_val) =>
    str.tostring(dayofmonth(time_val), "00") + '.' + str.tostring(month(time_val), "00") + '.' + str.tostring(year(time_val)) + ' (' + str.tostring(hour(time_val), "00") + ':' + str.tostring(minute(time_val), "00") + ':' +  str.tostring(second(time_val), "00") + ')'

bar_number = last_bar_index+1

var label label_ema1 = na
var label label_ema2 = na
var label label_ema3 = na

if barstate.islast
    string time_str = ''
    period = timeframe.period
    gwr = GetWinRate()
    text_color_wr = gwr > 0 ? color.green : gwr < 0 ? color.red : color.gray
    text_color_np = strategy.netprofit > 0 ? color.green : strategy.netprofit < 0 ? color.red : color.gray
    text_color_single = close_e-close_s > 0 ? color.green : close_e-close_s < 0 ? color.red : color.gray

    switch
        period=="1" => time_str := '1 dakika'
        period=="3" => time_str := '3 dakika'
        period=="5" => time_str := '5 dakika'
        period=="15" => time_str := '15 dakika'
        period=="30" => time_str := '30 dakika'
        period=="45" => time_str := '45 dakika'
        period=="60" => time_str := '1 saat'
        period=="120" => time_str := '2 saat'
        period=="180" => time_str := '3 saat'
        period=="240" => time_str := '4 saat'
        str.pos(period, "D")>=0 => time_str := '1 gün'
        str.pos(period, "W")>=0 => time_str := '1 hafta'
        str.pos(period, "M")>=0 => time_str := '1 ay'

    var table m_table = table.new(position.bottom_right, columns=2, rows=13, bgcolor=color.rgb(212, 212, 212), border_width=1, border_color=color.white)

    table.merge_cells(m_table, 0, 0, 1, 0)

    last_time = StopYear==9999 ? time : PeriodStop

    period_start = str.tostring(dayofmonth(PeriodStart), "00") + '.' + str.tostring(month(PeriodStart), "00") + '.' + str.tostring(year(PeriodStart))
    period_end = str.tostring(dayofmonth(last_time), "00") + '.' + str.tostring(month(last_time), "00") + '.' + str.tostring(year(last_time))

    table.cell(m_table, 0, 0, "Niteya ST (" + period_start + "-" + period_end + ")" + ' - ' + str.tostring(time_str), text_color=color.white, text_halign=text.align_center, text_size=size.normal, bgcolor=color.new(#31153a, 0))

    table.cell(m_table, 0, 1, 'Karlı yüzde (%)', text_color=color.rgb(244, 244, 244), text_halign=text.align_left, text_size=size.normal, bgcolor=color.orange)
    table.cell(m_table, 0, 2, 'Net kar (%)', text_color=color.rgb(244, 244, 244), text_halign=text.align_left, text_size=size.normal, bgcolor=color.orange)
    table.cell(m_table, 0, 3, 'Açılan işlemler', text_color=color.rgb(244, 244, 244), text_halign=text.align_left, text_size=size.normal, bgcolor=color.orange)
    table.cell(m_table, 0, 4, 'Kapanan işlemler', text_color=color.rgb(244, 244, 244), text_halign=text.align_left, text_size=size.normal, bgcolor=color.orange)
    table.cell(m_table, 0, 5, 'Başlangıç tarihi', text_color=color.rgb(244, 244, 244), text_halign=text.align_left, text_size=size.normal, bgcolor=color.orange)
    table.cell(m_table, 0, 6, 'Bitiş tarihi', text_color=color.rgb(244, 244, 244), text_halign=text.align_left, text_size=size.normal, bgcolor=color.orange)
    table.cell(m_table, 0, 7, 'Long/Toplam bar sayısı', text_color=color.rgb(244, 244, 244), text_halign=text.align_left, text_size=size.normal, bgcolor=color.orange)

    table.cell(m_table, 0, 8, 'İlk fiyat (' + period_start + ')', text_color=color.rgb(244, 244, 244), text_halign=text.align_left, text_size=size.normal, bgcolor=color.rgb(103, 74, 31))
    table.cell(m_table, 0, 9, 'Son fiyat (' + period_end + ')', text_color=color.rgb(244, 244, 244), text_halign=text.align_left, text_size=size.normal, bgcolor=color.rgb(103, 74, 31))
    table.cell(m_table, 0, 10, 'Net kar (%)', text_color=color.rgb(244, 244, 244), text_halign=text.align_left, text_size=size.normal, bgcolor=color.rgb(103, 74, 31))
    table.cell(m_table, 0, 11, 'Net kar', text_color=color.rgb(244, 244, 244), text_halign=text.align_left, text_size=size.normal, bgcolor=color.rgb(103, 74, 31))
    table.cell(m_table, 0, 12, 'Fiyat', text_color=color.rgb(244, 244, 244), text_halign=text.align_left, text_size=size.normal, bgcolor=color.rgb(148, 107, 44))

    if not na(gwr)
        table.cell(m_table, 1, 1, str.tostring(gwr, '0.00'), text_color=text_color_wr, text_halign=text.align_right, text_size=size.normal, bgcolor=color.rgb(212, 212, 212))
        table.cell(m_table, 1, 2, str.tostring((100*strategy.netprofit)/strategy.initial_capital, '0.00'), text_color=text_color_np, text_halign=text.align_right, text_size=size.normal, bgcolor=color.rgb(212, 212, 212))
        table.cell(m_table, 1, 3, str.tostring(long_no), text_color=#505050, text_halign=text.align_right, text_size=size.normal, bgcolor=color.rgb(212, 212, 212))
        table.cell(m_table, 1, 4, str.tostring(strategy.closedtrades), text_color=#505050, text_halign=text.align_right, text_size=size.normal, bgcolor=color.rgb(212, 212, 212))

    table.cell(m_table, 1, 5, str.tostring(dayofmonth(PeriodS1), "00") + '.' + str.tostring(month(PeriodS1), "00") + '.' + str.tostring(year(PeriodS1)), text_color=#505050, text_halign=text.align_right, text_size=size.normal, bgcolor=color.rgb(212, 212, 212))
    table.cell(m_table, 1, 6, str.tostring(dayofmonth(PeriodS2), "00") + '.' + str.tostring(month(PeriodS2), "00") + '.' + str.tostring(year(PeriodS2)), text_color=#505050, text_halign=text.align_right, text_size=size.normal, bgcolor=color.rgb(212, 212, 212))

    table.cell(m_table, 1, 7, str.tostring(bar_number_long) + '/' + str.tostring(bar_number_period), text_color=#505050, text_halign=text.align_right, text_size=size.normal, bgcolor=color.rgb(212, 212, 212))

    np = (close_e-close_s)*(strategy.initial_capital/close_s)

    table.cell(m_table, 1, 8, str.tostring(close_s, '0.00'), text_color=#505050, text_halign=text.align_right, text_size=size.normal, bgcolor=color.rgb(212, 212, 212))
    table.cell(m_table, 1, 9, str.tostring(close_e, '0.00'), text_color=#505050, text_halign=text.align_right, text_size=size.normal, bgcolor=color.rgb(212, 212, 212), tooltip=str.tostring(close_e, '0.00') + ' - ' + str.tostring(volume, '0')) // volume*close
    table.cell(m_table, 1, 10, str.tostring((100*np)/strategy.initial_capital, '0.00'), text_color=text_color_single, text_halign=text.align_right, text_size=size.normal, bgcolor=color.rgb(212, 212, 212))
    table.cell(m_table, 1, 11, str.tostring(np, '0.00'), text_color=text_color_single, text_halign=text.align_right, text_size=size.normal, bgcolor=color.rgb(212, 212, 212))
    table.cell(m_table, 1, 12, str.tostring(close, '0.00'), text_color=text_color_single, text_halign=text.align_right, text_size=size.normal, bgcolor=color.rgb(212, 212, 212))

    if is_ema_lines
        label.delete(label_ema1)
        label.delete(label_ema2)
        label.delete(label_ema3)

        label_ema1 := label.new(x=bar_index+2, y=ema_11, text=str.tostring(ema_length1), color=color.blue, style=label.style_label_center, textcolor=color.white, size=size.small)
        label_ema2 := label.new(x=bar_index+2, y=ema_12, text=str.tostring(ema_length2), color=color.orange, style=label.style_label_center, textcolor=color.white, size=size.small)
        label_ema3 := label.new(x=bar_index+2, y=ema_13, text=str.tostring(ema_length3), color=color.black, style=label.style_label_center, textcolor=color.white, size=size.small)
Yukarıdaki strateji ile ilgili bir uygulama aşağıdaki grafikte gösterilmektedir.

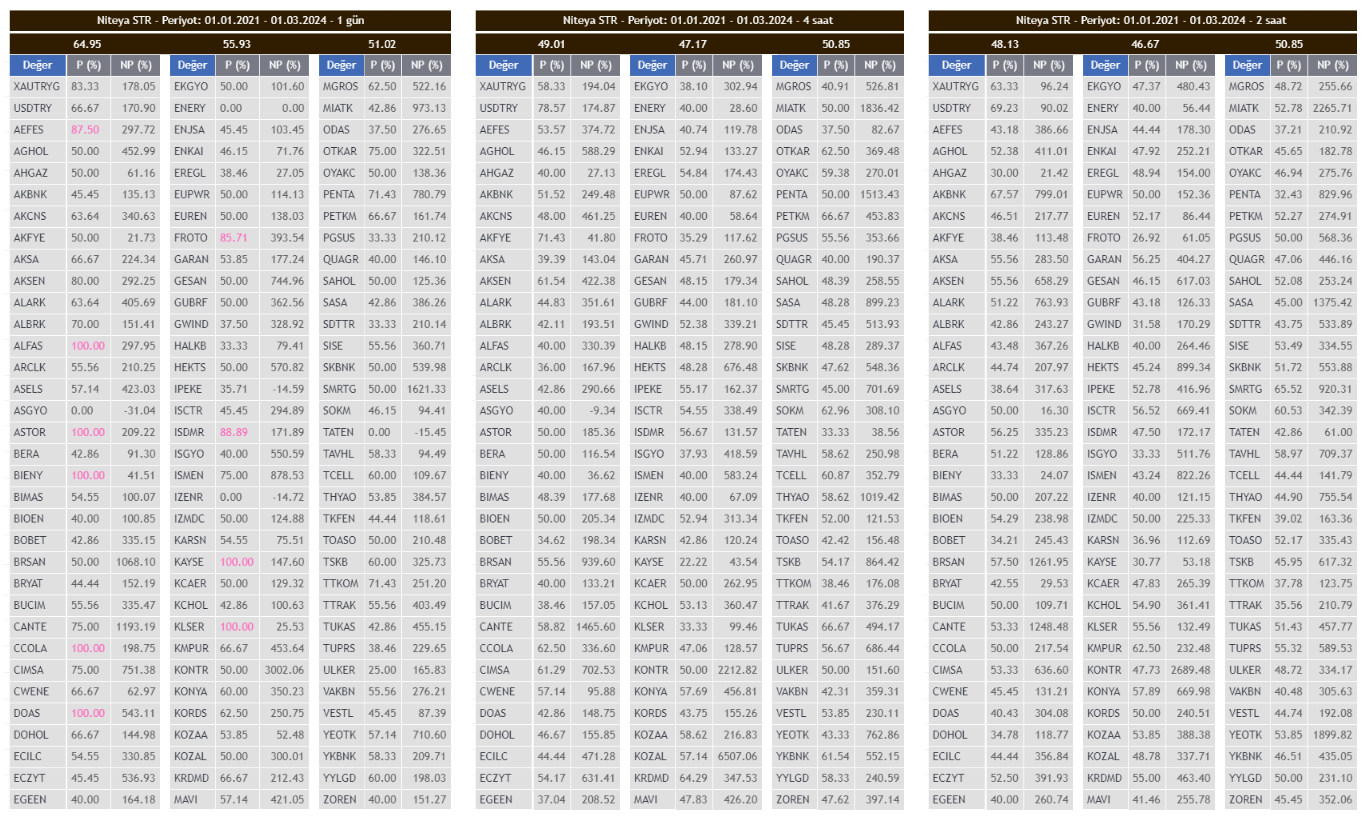
Yukarıdaki strateji ile ilgili olarak, 02.03.2024 tarihinde gram altın, USDTRY ve BIST100 hisseleri ile 1 gün, 4 saat, 2 saat, 1 saat, 30 dakika ve 15 dakikalık zaman periyodlarında yapılan backtest işlem sonuçları aşağıdaki grafiklerde gösterilmektedir. Bu çizelgelerden stratejinin hangi hisse senetleri için daha verimli sonuçlar elde ettiğini kontrol edebilirsiniz.
Aşağıda verilen 6 farklı zaman periyodundaki grafiklerin backtest aralığı 01.01.2021 - 01.03.2024 olarak yapılmasına rağmen,TradingView ortamındaki 5000 bara kadar okuma sınırlaması nedeniyle 1 saatlik, 30 dakikalık ve 15 dakikalık backtest işlemlerinde başlangıç tarihleri ileri doğru kaydırılmaktadır. Zaman periyodları gerçek backtest aralıkları aşağıdaki çizelgede gösterilmektedir:
Periyot   Başlangıç    Bitiş

1 gün     01.01.2021 - 01.03.2024
4 saat    01.01.2021 - 01.03.2024
2 saat    01.01.2021 - 01.03.2024
1 saat    03.01.2022 - 01.03.2024
30 dakika 02.01.2023 - 01.03.2024
15 dakika 01.08.2023 - 01.03.2024
Sütun başlıklarının anlamları aşağıda gösterilmektedir:
Değer Maddi değerin kodu
P (%) Karlı yüzde değeri (Bu sütunun en üstünde yer alan değer bu sütundaki değerlerin ortalamasıdır.)
NP (%) Net kazanç yüzde değeri
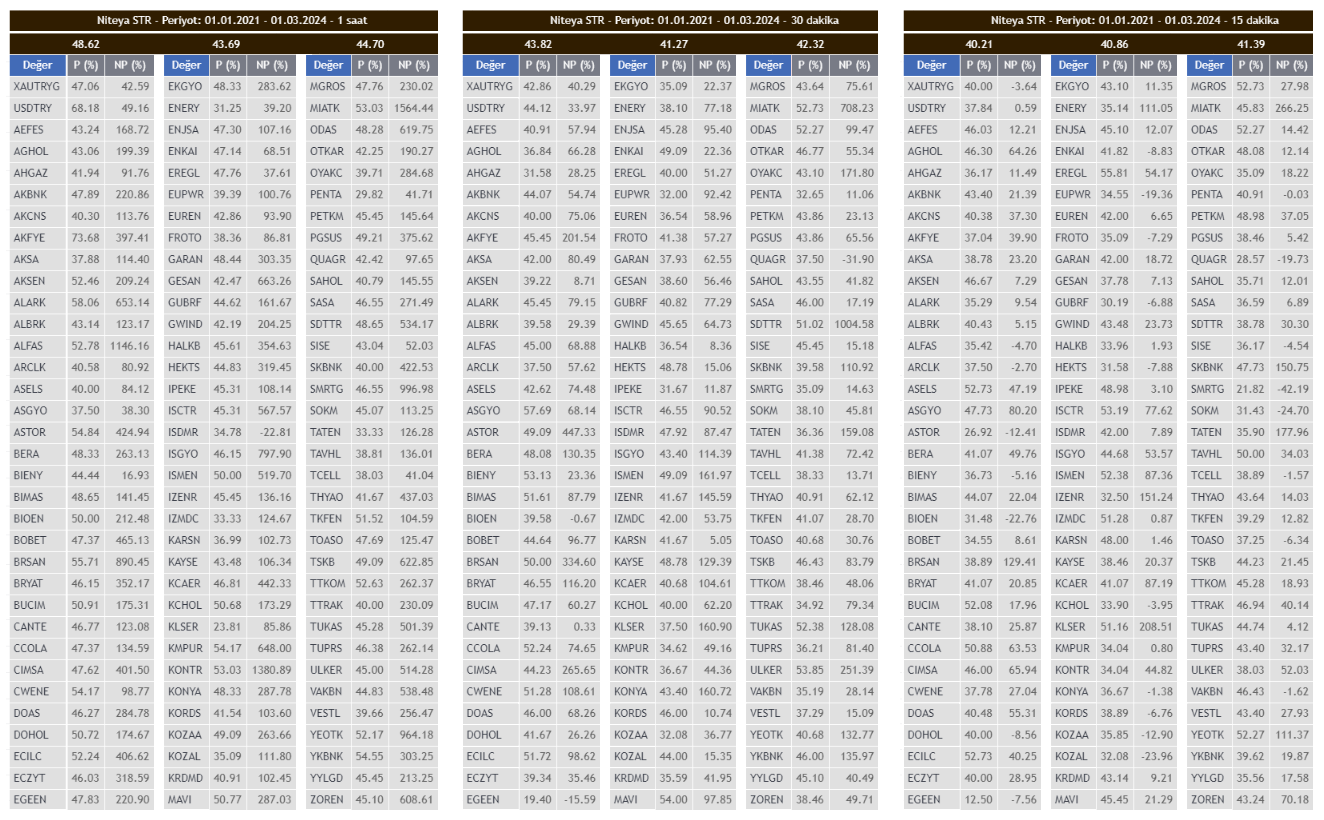
Herhangi bir strateji için, farklı backtest zaman aralığı seçtiğimizde sonuçların tamamen farklı olabileceğini dikkate almakta fayda vardır.