Bu strateji, aşağıda gösterilen ön tanımlı değerler ile kapanış değeri ve iki hareketli ortalama değeri kullanılarak oluşturulmuştur. Bir önceki stratejiye göre tek farkı strateji sonuçlarını gösteren bir tablo içermesidir.
Bu ayarlar, stratejinin "Ayarlar/Özellikler" sekmesinde değiştirilebilir.
Strateji aşağıda belirtilen esaslar dahilinde çalışır:
// This source code is subject to the terms of the Mozilla Public License 2.0 at https://mozilla.org/MPL/2.0/
// © Niteya
//@version=5
// Bu strateji şablonu sadece eğitim amaçlı olarak verilmiştir. Yatırım kararlarınızda kullanmayınız.
strategy("Niteya Strategy Moving Average", shorttitle='Niteya MA', overlay=true, calc_on_every_tick=true, commission_value=0.04, initial_capital=10000, default_qty_type=strategy.cash, default_qty_value=10000)

ma_type = input.string(title='MA type', defval='EMA', options=['EMA', 'SMA']) // Hareketli ortalama türü seçimi

// Hareketli ortalama uzunlukları seçimi
ma_length1 = input(20, 'MA Length1')
ma_length2 = input(50, 'MA Length2')

is_ma_line = input.bool(defval=false, title="MA Çizgileri") // Hareketli ortalama çizgisinin grafiğe çizilip çizilmeyeceğinin seçimi

ma_src = close // Hareketli ortalama kaynak değerinin atanması
// Hareketli ortalama değerlerinin alınması
ma_1 = ma_type=='EMA' ? ta.ema(ma_src, ma_length1) : ta.sma(ma_src, ma_length1)
ma_2 = ma_type=='EMA' ? ta.ema(ma_src, ma_length2) : ta.sma(ma_src, ma_length2)

line_width = 2 // Çizgi kalınlığı
// Hareketli ortalama değerlerinin grafiğe çizimi
plot(is_ma_line ? ma_1 : na, title="MA src1", color=color.blue, linewidth=line_width)
plot(is_ma_line ? ma_2 : na, title="MA src2", color=color.orange, linewidth=line_width)

// Long ve Short koşulların hesabı
ma_long =  ta.crossover(ma_1, ma_2) // Kısa hareketli ortalama değeri uzun hareketli ortalama değerini yukarı doğru keserse true, aksi takdirde false
ma_short = ta.crossunder(ma_1, ma_2) // Kısa hareketli ortalama değeri uzun hareketli ortalama değerini aşağı doğru keserse true, aksi takdirde false

long_cond = ma_long ? true : false // Long işleme giriş değerinin kontrolü
short_cond = ma_short ? true : false // Short işleme giriş değerinin kontrolü

var int long_no = 0
var int close_no = 0

entry_long_main = long_cond
entry_short_main = short_cond

entry_long = entry_long_main // Long işleme giriş değerinin kontrolü
entry_short = entry_short_main // Short işleme giriş değerinin kontrolü

// Active period calculations
var int PeriodS1 = 0 // Strateji backtest başlangıç tarihini gösteren değişken
var int PeriodS2 = 0 // Strateji backtest bitiş tarihini gösteren değişken
// First and last price of the ticker for the period
var float close_s = na // Strateji backtest başlangıç tarihindeki hisse fiyatını gösteren değişken
var float close_e = na // Strateji backtest bitiş tarihindeki hisse fiyatını gösteren değişken

// İlk barda değerleri atama
if barstate.isfirst
    PeriodS1 := timestamp(year(time), month(time), dayofmonth(time), 0, 0)
    PeriodS2 := timestamp(year(last_bar_time), month(last_bar_time), dayofmonth(last_bar_time), 0, 0)
    close_s := close

if entry_long and strategy.opentrades==0 // Long koşul gerçekleşmisse ve açılmış bir işlem yoksa long işlem aç
    strategy.entry('long', strategy.long, comment='BUY')
    long_no += 1

if strategy.opentrades>0 and entry_short // Short koşul gerçekleşmisse ve açılmış bir işlem varsa long işlemi kapat
    strategy.close_all(comment='SELL')
    close_no += 1

// Stratejinin kârlı yüzde oranını hesaplayan fonksiyon
GetWinRate(includeEvens = false) =>
	winTradeCount = strategy.wintrades +
         (includeEvens ? strategy.eventrades : 0)
	(winTradeCount / strategy.closedtrades) * 100

if(barstate.islast)
    string time_str = ''
    close_e := close
    period = timeframe.period
    gwr = GetWinRate()
    text_color_wr = gwr > 0 ? color.green : gwr < 0 ? color.red : color.gray
    text_color_np = strategy.netprofit > 0 ? color.green : strategy.netprofit < 0 ? color.red : color.gray
    text_color_single = close_e-close_s > 0 ? color.green : close_e-close_s < 0 ? color.red : color.gray

    tr = syminfo.currency=='TRY'

    // Zaman aralığını metein olarak alma
	switch
        period=="1" => time_str := '1 ' + (tr ? 'dakika' : 'minute')
        period=="3" => time_str := '3 ' + (tr ? 'dakika' : 'minute')
        period=="5" => time_str := '5 ' + (tr ? 'dakika' : 'minute')
        period=="15" => time_str := '15 ' + (tr ? 'dakika' : 'minute')
        period=="30" => time_str := '30 ' + (tr ? 'dakika' : 'minute')
        period=="45" => time_str := '45 ' + (tr ? 'dakika' : 'minute')
        period=="60" => time_str := '1 ' + (tr ? 'saat' : 'hour')
        period=="120" => time_str := '2 ' + (tr ? 'saat' : 'hour')
        period=="180" => time_str := '3 ' + (tr ? 'saat' : 'hour')
        period=="240" => time_str := '4 ' + (tr ? 'saat' : 'hour')
        str.pos(period, "D")>=0 => time_str := '1 ' + (tr ? 'gün' : 'day')
        str.pos(period, "W")>=0 => time_str := '1 ' + (tr ? 'hafta' : 'week')
        str.pos(period, "M")>=0 => time_str := '1 ' + (tr ? 'ay' : 'month')

    var table m_table = table.new(position.middle_left, columns=2, rows=14, bgcolor=color.rgb(212, 212, 212), border_width=1, border_color=color.white)

    table.merge_cells(m_table, 0, 0, 1, 0)

    table.cell(m_table, 0, 0, "Niteya MA (" + str.tostring(dayofmonth(PeriodS1), "00") + '.' + str.tostring(month(PeriodS1), "00") + '.' + str.tostring(year(PeriodS1)) + "-" +
     str.tostring(dayofmonth(time), "00") + '.' + str.tostring(month(time), "00") + '.' + str.tostring(year(time)) + ")", text_color=color.white, text_halign=text.align_center, text_size=size.normal, bgcolor=color.new(#31153a, 0))

    table.cell(m_table, 0, 1, tr ? 'Periyot' : 'Period', text_color=color.rgb(244, 244, 244), text_halign=text.align_left, text_size=size.large, bgcolor=color.orange)
    table.cell(m_table, 0, 2, tr ? 'İlk sermaye' : 'Capital' , text_color=color.rgb(244, 244, 244), text_halign=text.align_left, text_size=size.large, bgcolor=color.orange)
    table.cell(m_table, 0, 3, (tr ? 'Karlı yüzde' : 'Profitable percent') + ' (%)', text_color=color.rgb(244, 244, 244), text_halign=text.align_left, text_size=size.large, bgcolor=color.orange)
    table.cell(m_table, 0, 4, (tr ? 'Net kar' : 'Net profit') + ' (%)', text_color=color.rgb(244, 244, 244), text_halign=text.align_left, text_size=size.large, bgcolor=color.orange)
    table.cell(m_table, 0, 5, tr ? 'Net kar' : 'Net profit', text_color=color.rgb(244, 244, 244), text_halign=text.align_left, text_size=size.large, bgcolor=color.orange)
    table.cell(m_table, 0, 6, tr ? 'Açılan işlemler' : 'Opened trades', text_color=color.rgb(244, 244, 244), text_halign=text.align_left, text_size=size.large, bgcolor=color.orange)
    table.cell(m_table, 0, 7, tr ? 'Kapanan işlemler' : 'Closed trades', text_color=color.rgb(244, 244, 244), text_halign=text.align_left, text_size=size.large, bgcolor=color.orange)
    table.cell(m_table, 0, 8, tr ? 'Başlangıç tarihi' : 'Start date', text_color=color.rgb(244, 244, 244), text_halign=text.align_left, text_size=size.large, bgcolor=color.orange)
    table.cell(m_table, 0, 9, tr ? 'Bitiş tarihi' : 'Stop date', text_color=color.rgb(244, 244, 244), text_halign=text.align_left, text_size=size.large, bgcolor=color.orange)

    table.cell(m_table, 0, 10, tr ? 'İlk fiyat' : 'First price', text_color=color.rgb(244, 244, 244), text_halign=text.align_left, text_size=size.large, bgcolor=color.rgb(103, 74, 31))
    table.cell(m_table, 0, 11, tr ? 'Son fiyat' : 'Last price', text_color=color.rgb(244, 244, 244), text_halign=text.align_left, text_size=size.large, bgcolor=color.rgb(103, 74, 31))
    table.cell(m_table, 0, 12, (tr ? 'Net kar' : 'Net profit') + ' (%)', text_color=color.rgb(244, 244, 244), text_halign=text.align_left, text_size=size.large, bgcolor=color.rgb(103, 74, 31))
    table.cell(m_table, 0, 13, tr ? 'Net kar' : 'Net profit', text_color=color.rgb(244, 244, 244), text_halign=text.align_left, text_size=size.large, bgcolor=color.rgb(103, 74, 31))

    table.cell(m_table, 1, 1, str.tostring(time_str), text_color=#505050, text_halign=text.align_right, text_size=size.large, bgcolor=color.rgb(212, 212, 212))
    table.cell(m_table, 1, 2, str.tostring(strategy.initial_capital), text_color=#505050, text_halign=text.align_right, text_size=size.large, bgcolor=color.rgb(212, 212, 212))

    if not na(gwr)
        table.cell(m_table, 1, 3, str.tostring(gwr, '0.00'), text_color=text_color_wr, text_halign=text.align_right, text_size=size.large, bgcolor=color.rgb(212, 212, 212))
        table.cell(m_table, 1, 4, str.tostring((100*strategy.netprofit)/strategy.initial_capital, '0.00'), text_color=text_color_np, text_halign=text.align_right, text_size=size.large, bgcolor=color.rgb(212, 212, 212))
        table.cell(m_table, 1, 5, str.tostring(strategy.netprofit, '0.00'), text_color=text_color_np, text_halign=text.align_right, text_size=size.large, bgcolor=color.rgb(212, 212, 212))
        table.cell(m_table, 1, 6, str.tostring(long_no), text_color=#505050, text_halign=text.align_right, text_size=size.large, bgcolor=color.rgb(212, 212, 212))
        table.cell(m_table, 1, 7, str.tostring(strategy.closedtrades), text_color=#505050, text_halign=text.align_right, text_size=size.large, bgcolor=color.rgb(212, 212, 212))

    table.cell(m_table, 1, 8, str.tostring(dayofmonth(PeriodS1), "00") + '.' + str.tostring(month(PeriodS1), "00") + '.' + str.tostring(year(PeriodS1)), text_color=#505050, text_halign=text.align_right, text_size=size.large, bgcolor=color.rgb(212, 212, 212))
    table.cell(m_table, 1, 9, str.tostring(dayofmonth(PeriodS2), "00") + '.' + str.tostring(month(PeriodS2), "00") + '.' + str.tostring(year(PeriodS2)), text_color=#505050, text_halign=text.align_right, text_size=size.large, bgcolor=color.rgb(212, 212, 212))

    np = (close_e-close_s)*(strategy.initial_capital/close_s)

    table.cell(m_table, 1, 10, str.tostring(close_s, '0.000'), text_color=#505050, text_halign=text.align_right, text_size=size.large, bgcolor=color.rgb(212, 212, 212))
    table.cell(m_table, 1, 11, str.tostring(close_e, '0.000'), text_color=#505050, text_halign=text.align_right, text_size=size.large, bgcolor=color.rgb(212, 212, 212))
    table.cell(m_table, 1, 12, str.tostring((100*np)/strategy.initial_capital, '0.00'), text_color=text_color_single, text_halign=text.align_right, text_size=size.large, bgcolor=color.rgb(212, 212, 212))
    table.cell(m_table, 1, 13, str.tostring(np, '0.00'), text_color=text_color_single, text_halign=text.align_right, text_size=size.large, bgcolor=color.rgb(212, 212, 212))
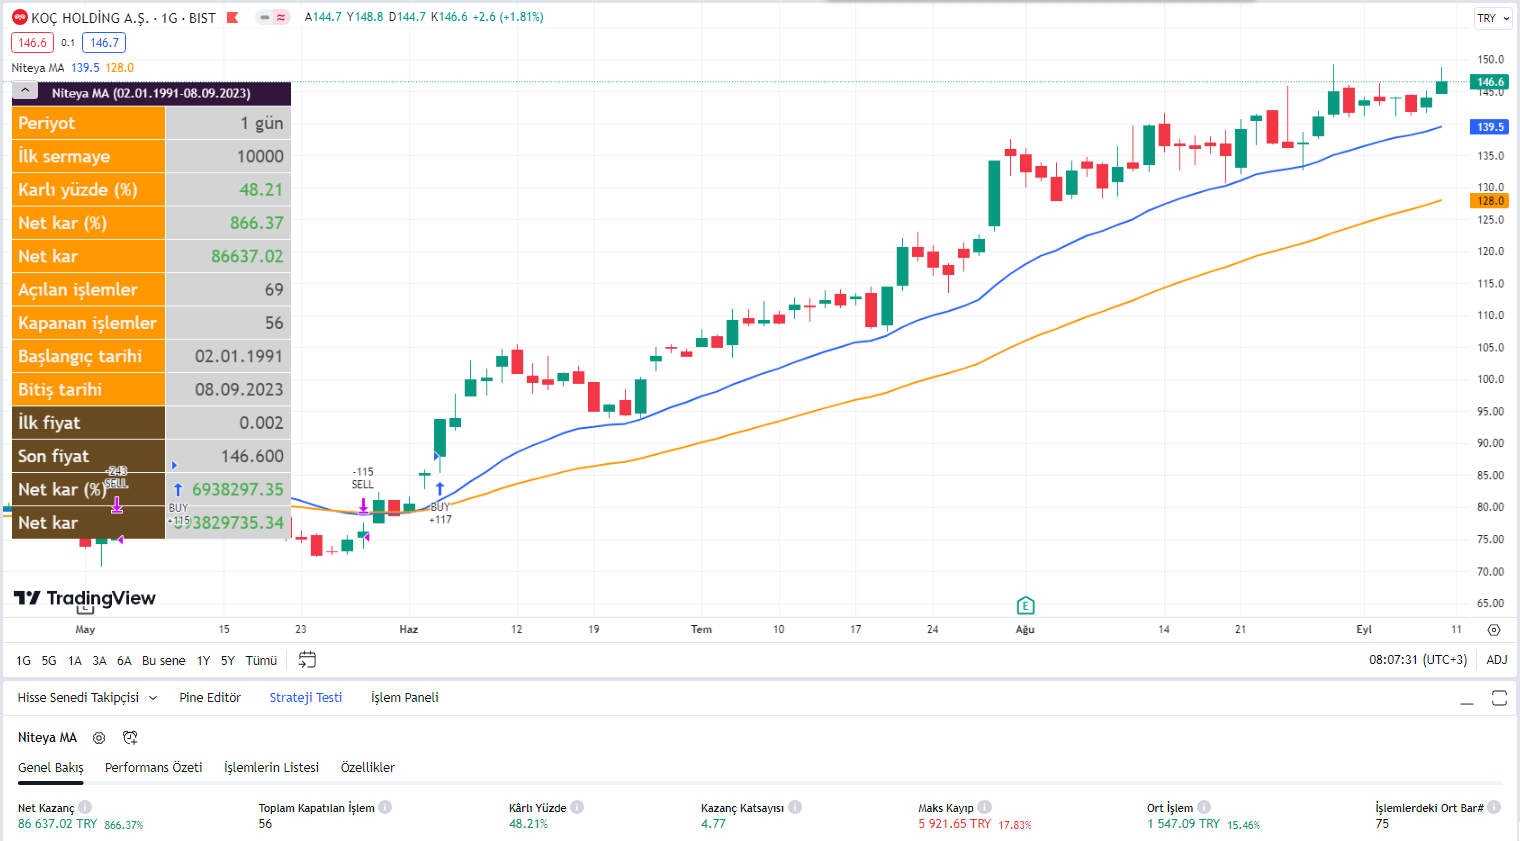
Yukarıdaki strateji ile ilgili bir uygulama aşağıdaki grafikte gösterilmektedir: