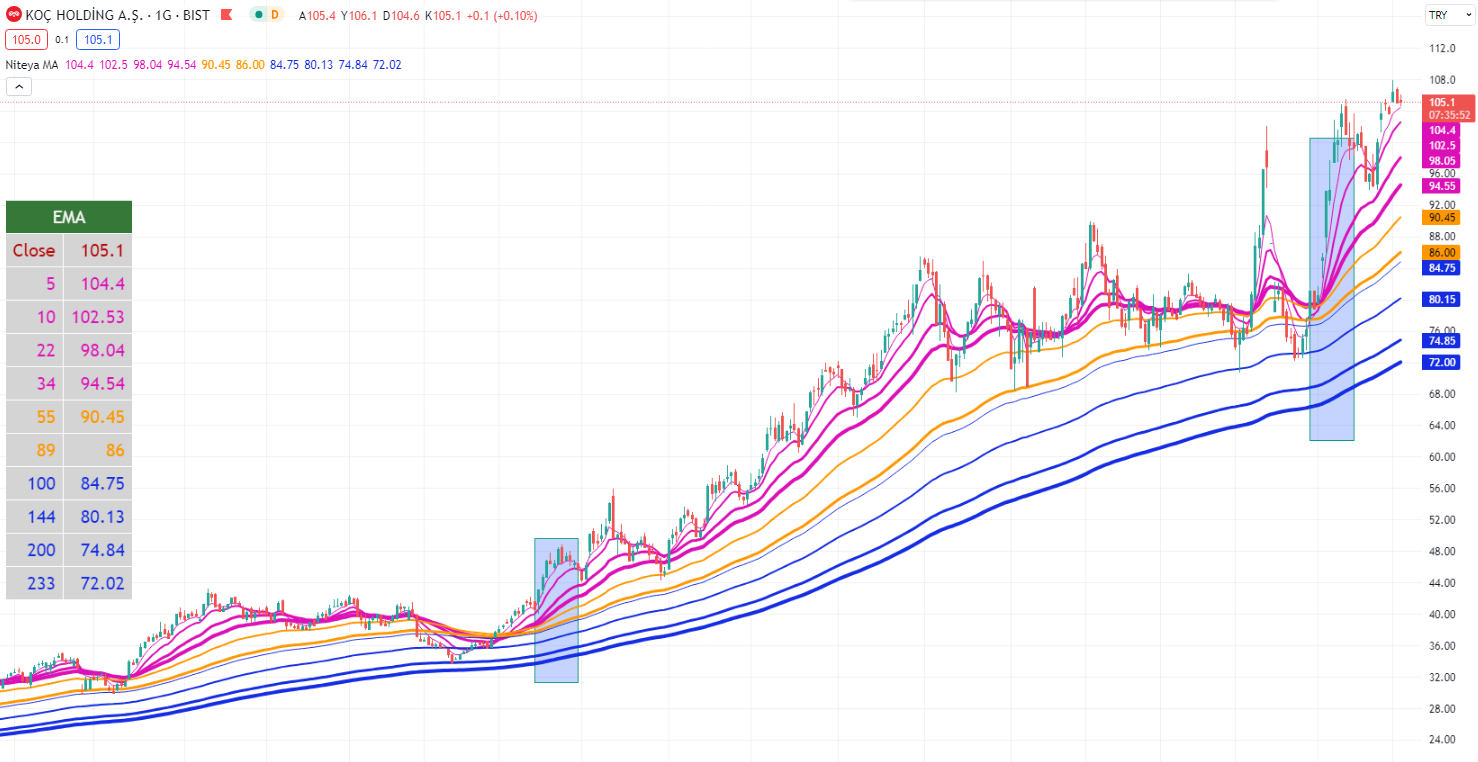

Bu indikatör, kısa, orta ve uzun vadeli 10 farklı hareketli ortalama (SMA veya EMA) değerini (5, 10, 22, 34, 55, 89, 100, 144, 200, 233) grafik üzerinde ve bir tabloda gösterir. Hareketli ortalama değerleri tablo içinde kapanış fiyatı da dahil olmak üzere büyükten küçüğe doğru sıralanır.
Kapanış fiyatı en üstte olmak üzere en düşük uzunluktaki hareketli ortalama değerinden en yüksek uzunluktaki hareketli ortalama değerine doğru sıra ile tabloda yer aldıklarında ideal alım koşulu gerçekleşir.
// This source code is subject to the terms of the Mozilla Public License 2.0 at https://mozilla.org/MPL/2.0/
// © Niteya
//@version=5
indicator(title="Niteya Moving Average", shorttitle="Niteya MA", overlay=true)

// Moving average
src = input(title='Source', defval=close)
ma_type = input.string(title='MA type', defval='EMA', options=['EMA', 'SMA'])

length1 = input(5, 'MA Length1')
length2 = input(10, 'MA Length2')
length3 = input(22, 'MA Length3')
length4 = input(34, 'MA Length4')
length5 = input(55, 'MA Length5')
length6 = input(89, 'MA Length6')
length7 = input(100, 'MA Length7')
length8 = input(144, 'MA Length8')
length9 = input(200, 'MA Length9')
length10 = input(233, 'MA Length10')

MA1 = ma_type=='EMA' ? ta.ema(src, length1) : ta.sma(src, length1)
MA2 = ma_type=='EMA' ? ta.ema(src, length2) : ta.sma(src, length2)
MA3 = ma_type=='EMA' ? ta.ema(src, length3) : ta.sma(src, length3)
MA4 = ma_type=='EMA' ? ta.ema(src, length4) : ta.sma(src, length4)
MA5 = ma_type=='EMA' ? ta.ema(src, length5) : ta.sma(src, length5)
MA6 = ma_type=='EMA' ? ta.ema(src, length6) : ta.sma(src, length6)
MA7 = ma_type=='EMA' ? ta.ema(src, length7) : ta.sma(src, length7)
MA8 = ma_type=='EMA' ? ta.ema(src, length8) : ta.sma(src, length8)
MA9 = ma_type=='EMA' ? ta.ema(src, length9) : ta.sma(src, length9)
MA10 = ma_type=='EMA' ? ta.ema(src, length10) : ta.sma(src, length10)

color_short = input.color(#dc10b7, 'Kısa vade rengi')
color_middle = input.color(color.orange, 'Orta vade rengi')
color_long = input.color(#152de2, 'Uzun vade rengi')

plot(MA1, color=color_short, linewidth=1, title='MA1')
plot(MA2, color=color_short, linewidth=2, title='MA2')
plot(MA3, color=color_short, linewidth=3, title='MA3')
plot(MA4, color=color_short, linewidth=4, title='MA4')
plot(MA5, color=color_middle, linewidth=2, title='MA5')
plot(MA6, color=color_middle, linewidth=3, title='MA6')
plot(MA7, color=color_long, linewidth=1, title='MA7')
plot(MA8, color=color_long, linewidth=2, title='MA8')
plot(MA9, color=color_long, linewidth=3, title='MA9')
plot(MA10, color=color_long, linewidth=4, title='MA10')

if barstate.islast

    var table m_table = table.new(position.middle_left, columns=2, rows=12, bgcolor=#d4d4d4, border_width=1, border_color=color.white)
	text_color_close = open>close ? #b40606 : #367838

    array_ma_str = array.from('Close', str.tostring(length1), str.tostring(length2), str.tostring(length3), str.tostring(length4), str.tostring(length5),
	 str.tostring(length6), str.tostring(length7), str.tostring(length8), str.tostring(length9), str.tostring(length10))
    array_ma = array.from(close, MA1, MA2, MA3, MA4, MA5, MA6, MA7, MA8, MA9, MA10)
	array_color = array.from(text_color_close, color_short, color_short, color_short, color_short, color_middle, color_middle, color_long, color_long, color_long, color_long)

    sortedIndices = array.sort_indices(array_ma, order.descending)

    table.merge_cells(m_table, 0, 0, 1, 0)
	header_bg_color = (close>MA1 and MA1>MA2 and MA2>MA3 and MA3>MA4  and MA4>MA5 and MA5>MA6 and MA6>MA7 and MA7>MA8 and MA8>MA9 and MA9>MA10) ? #367838 : #b40606
	table.cell(m_table, 0, 0, ma_type, text_color=color.rgb(244, 244, 244), text_halign=text.align_center, text_size=size.large, bgcolor=header_bg_color)

    table.cell(m_table, 0, 1, array.get(array_ma_str, array.get(sortedIndices, 0)), text_color=array.get(array_color, array.get(sortedIndices, 0)), text_halign=text.align_right, text_size=size.large)
	table.cell(m_table, 0, 2, array.get(array_ma_str, array.get(sortedIndices, 1)), text_color=array.get(array_color, array.get(sortedIndices, 1)), text_halign=text.align_right, text_size=size.large)
	table.cell(m_table, 0, 3, array.get(array_ma_str, array.get(sortedIndices, 2)), text_color=array.get(array_color, array.get(sortedIndices, 2)), text_halign=text.align_right, text_size=size.large)
	table.cell(m_table, 0, 4, array.get(array_ma_str, array.get(sortedIndices, 3)), text_color=array.get(array_color, array.get(sortedIndices, 3)), text_halign=text.align_right, text_size=size.large)
	table.cell(m_table, 0, 5, array.get(array_ma_str, array.get(sortedIndices, 4)), text_color=array.get(array_color, array.get(sortedIndices, 4)), text_halign=text.align_right, text_size=size.large)
	table.cell(m_table, 0, 6, array.get(array_ma_str, array.get(sortedIndices, 5)), text_color=array.get(array_color, array.get(sortedIndices, 5)), text_halign=text.align_right, text_size=size.large)
	table.cell(m_table, 0, 7, array.get(array_ma_str, array.get(sortedIndices, 6)), text_color=array.get(array_color, array.get(sortedIndices, 6)), text_halign=text.align_right, text_size=size.large)
	table.cell(m_table, 0, 8, array.get(array_ma_str, array.get(sortedIndices, 7)), text_color=array.get(array_color, array.get(sortedIndices, 7)), text_halign=text.align_right, text_size=size.large)
	table.cell(m_table, 0, 9, array.get(array_ma_str, array.get(sortedIndices, 8)), text_color=array.get(array_color, array.get(sortedIndices, 8)), text_halign=text.align_right, text_size=size.large)
	table.cell(m_table, 0, 10, array.get(array_ma_str, array.get(sortedIndices, 9)), text_color=array.get(array_color, array.get(sortedIndices, 9)), text_halign=text.align_right, text_size=size.large)
	table.cell(m_table, 0, 11, array.get(array_ma_str, array.get(sortedIndices, 10)), text_color=array.get(array_color, array.get(sortedIndices, 10)), text_halign=text.align_right, text_size=size.large)

    table.cell(m_table, 1, 1, str.tostring(array.get(array_ma, array.get(sortedIndices, 0)), '#.##'), text_color=array.get(array_color, array.get(sortedIndices, 0)), text_halign=text.align_right, text_size=size.large)
	table.cell(m_table, 1, 2, str.tostring(array.get(array_ma, array.get(sortedIndices, 1)), '#.##'), text_color=array.get(array_color, array.get(sortedIndices, 1)), text_halign=text.align_right, text_size=size.large)
	table.cell(m_table, 1, 3, str.tostring(array.get(array_ma, array.get(sortedIndices, 2)), '#.##'), text_color=array.get(array_color, array.get(sortedIndices, 2)), text_halign=text.align_right, text_size=size.large)
	table.cell(m_table, 1, 4, str.tostring(array.get(array_ma, array.get(sortedIndices, 3)), '#.##'), text_color=array.get(array_color, array.get(sortedIndices, 3)), text_halign=text.align_right, text_size=size.large)
	table.cell(m_table, 1, 5, str.tostring(array.get(array_ma, array.get(sortedIndices, 4)), '#.##'), text_color=array.get(array_color, array.get(sortedIndices, 4)), text_halign=text.align_right, text_size=size.large)
	table.cell(m_table, 1, 6, str.tostring(array.get(array_ma, array.get(sortedIndices, 5)), '#.##'), text_color=array.get(array_color, array.get(sortedIndices, 5)), text_halign=text.align_right, text_size=size.large)
	table.cell(m_table, 1, 7, str.tostring(array.get(array_ma, array.get(sortedIndices, 6)), '#.##'), text_color=array.get(array_color, array.get(sortedIndices, 6)), text_halign=text.align_right, text_size=size.large)
	table.cell(m_table, 1, 8, str.tostring(array.get(array_ma, array.get(sortedIndices, 7)), '#.##'), text_color=array.get(array_color, array.get(sortedIndices, 7)), text_halign=text.align_right, text_size=size.large)
	table.cell(m_table, 1, 9, str.tostring(array.get(array_ma, array.get(sortedIndices, 8)), '#.##'), text_color=array.get(array_color, array.get(sortedIndices, 8)), text_halign=text.align_right, text_size=size.large)
	table.cell(m_table, 1, 10, str.tostring(array.get(array_ma, array.get(sortedIndices, 9)), '#.##'), text_color=array.get(array_color, array.get(sortedIndices, 9)), text_halign=text.align_right, text_size=size.large)
	table.cell(m_table, 1, 11, str.tostring(array.get(array_ma, array.get(sortedIndices, 10)), '#.##'), text_color=array.get(array_color, array.get(sortedIndices, 10)), text_halign=text.align_right, text_size=size.large)
Yukarıdaki indikatörün bir uygulaması aşağıda grafikte gösterilmektedir. Kapanış fiyatı en üstte olmak üzere en düşük uzunluktaki hareketli ortalama değerinden en yüksek uzunluktaki hareketli ortalama değerine doğru sıra ile tabloda yer aldıklarında ideal alım koşulu gerçekleşir.
